Monday 1 Apr 2013
Most comprehensive European rail comparison study published
- Region & Route:
- National
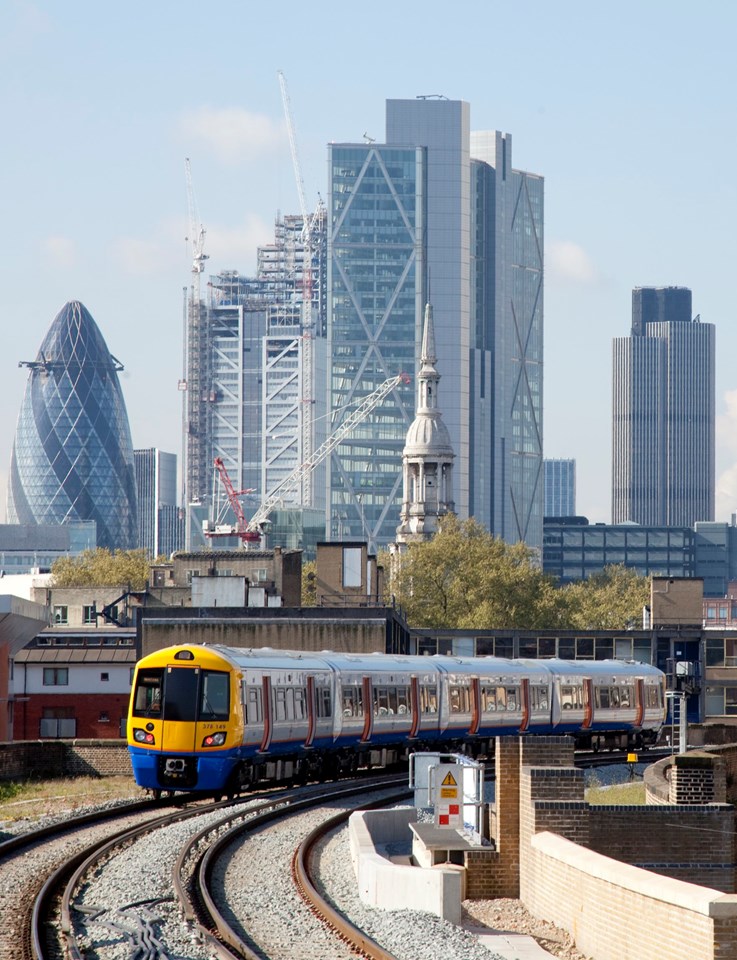
Britain's railways are the most improved in Europe, according to the most comprehensive comparison study yet published of the rail networks in all 27 EU countries.
The report looks at how the railways in Europe have progressed and improved since the 1990s according to a range of 14 different factors. Britain came top in four of the factors, second and third in another two and fourth in three, coming top overall (see footnote 1)*.
Europe’s other big rail networks - Germany, France and Italy - came 7th, 10th and 23rd respectively.
Network Rail's chief executive, David Higgins said: "We made clear in our five year plan published in January that we are under no illusion about the challenges that both we, and the passengers who use the railway, face on a daily basis, and the need to keep improving from the low base to which Britain's railway had sunk in the 1990s. We continue to work with other railways so that we can all learn from best practice in our businesses and we welcome efforts by the Commission to provide improved consistency and transparency of data.
“This report shows both the progress that we have made in driving forward our performance, and the very real challenges and opportunities that the growth in demand poses for us all. We run one of Europe’s most intense, fastest growing railways with all the implications for wear and tear as well as congestion that that implies. That is why we have made the case for sustained investment in both renewing and modernising the railway while increasing its capacity.”
Vice-President of the Commission, Transport Commissioner Siim Kallas, said: “Europe's railways are in transition. New investment and new business models are needed to take advantage of the opportunities arising from high fuel costs, urbanisation and the need to decarbonise – and to counter the loss of government subsidies in a time of economic difficulty. That is why in January the Commission proposed major reforms in particular for the European passenger market. Today's report helps us compare railways across the EU in order to identify best practice. And it shows that there are many lessons to be learnt from the UK experience."
Michael Roberts, chief executive of the Association of Train Operating Companies, said: “This assessment highlights the real benefit which privately-run, publicly-accountable train companies have brought to passengers and taxpayers in Britain. After decades of decline, a booming railway is generating more money to pay for improvements both now and in the future, and it is good news if others in Europe can benefit from our experience.
“But we know there is still much to improve and many challenges to meet in the coming years, so we are working hard with the rest of the industry to make rail travel more affordable and offer even more and faster services that meet passengers’ expectations.”
Graham Smith, director-general of the Rail Delivery Group said; ‘It is pleasing to see the UK at the top of the European rail league in so many respects. It is the job of the Rail Delivery Group to keep the UK in that position and to lead the industry in improving its placing where there are opportunities for improvement’.
Notes to editors
The study can be found on the following link http://ec.europa.eu/commission_2010-2014/kallas/headlines/news/2013/01/doc/swd(2013)-10-part3.pdf and was published amongst dozens of documents about the future of rail in Europe.
Britain’s railway has seen 27.5% growth in passenger journeys over the last five years (source: http://dataportal.orr.gov.uk/displayreport/report/html/22c71959-3f97-405f-8342-e4981745d08b)
The European Commission report looks at the opening of the market for domestic passenger services and governance of the railway infrastructure. It sources data from the 25 of the 27 member states that have railways and conducted passenger interviews with some 26,000 passengers across Europe. Some of the more interesting statistics in the study include:
Description | UK | Germany | France | Italy |
Scale of operation (route miles) | 9,826 (4th) | 23,487 (1st) | 19,288 (2nd) | 10,271 (3rd) |
Thousands train kms | 508m (2nd) | 396m (3rd) | 675m (1st) | 266m (4th) |
Intensity of infrastructure * (passenger km/km of track) | 2nd | 6th | 4th | 3rd |
Passenger km growth (1995-2008) | 71% | 19% | 8% | 10% |
Government subsidy (2009 (euros)) | 5.1bn | 13.5bn | 10.9bn | 8.1bn |
Railway employees (2008) | 90,000 | 178,000 | 160,000 | 94,000 |
Punctuality (2011)** | 91.5% | 80% | 90.8% | 93.3% |
Increase in the cost of rail prices (2000-11)*** | 34% | 16% | 10% | 25% |
Reduction in public subsidy (2000-2008) | -23% | -20% | +48% | +28% |
Passenger satisfaction with punctuality/reliability | 87% | 53% | 55% | 63% |
Passenger satisfaction with train frequency | 84% | 74% | 73% | 73% |
Passenger satisfaction with information | 80% | 50% | 48% | 69% |
Overall comparison | ||||
The report concludes by looking at over a dozen different factors and measurements of the EU Member states’ railways from 1997 to 2012**** | 1st | 7th | 10th | 23rd |
* The UK has the most intensively used large network in Europe. The Netherlands comes first in this measure with a network of just 1,795 miles
**measured substantially differently in each country with the UK’s measurement of punctuality being the most accurate and most stringent (GB measure includes all trains and all causes of delays including external factors such as flooding, fatalities, vandalism. Most European countries ignore some or all of this )
***The real terms increase in the cost of fares over the period. European average is 28%
Footnote 1:
The following table details the 14 factors measured by the European study and the position of the four largest countries’ railways for comparison:
Description | UK | Germany | France | Italy |
Growth of modal shift (modal shift of passenger transport to rail from 1993 to 2010) | 1st | 5th | 3rd | 13th |
Growth of satisfaction (the increase in overall passenger satisfaction with rail services 97-12) | 1st | 15th | 3rd | 6th |
Growth of availability (growth of train kms 93-08) | 7th | 13th | 6th | 9th |
Growth of productivity of rolling stock/frequency (growth of train kms per rolling stock 90-08) | 8th | 10th | 15th | 16th |
Growth of fares (real terms % increase in the cost of rail fares) | 9th | 16th | 23rd | 12th |
Growth of pkm/train km (average growth between 00 to 08 of passenger km / train km) | 4th | 5th | 6th | 14th |
Growth of pkm/line (the growth of the ration between passenger km/track km) | 1st | 8th | 7th | 11th |
Growth of employment (the growth of employment in the rail industry between 00 to 08) | 2nd | 6th | 8th | 15th |
Growth of productivity of labour (comparing million domestic passenger km per staff member) | 3rd | 5th | 11th | 7th |
Improvement of subsidy efficiency (comparing the growth of passenger km with size of subsidy) | 3rd | 4th | 10th | 11th |
Punctuality (using 2011 data) | 7th | 15th | 8th | 4th |
Safety (comparing the number of people killed or injured per thousand train km) | 1st | 6th | 3rd | 11th |
Satisfaction (overall service satisfaction measure taken from 2012 survey on competition in rail) | 11th | 14th | 8th | 23rd |
Satisfaction (taken from detailed rail survey on quality of services, frequency, punctuality &reliability, information provision and cleanliness) | 4th | unplaced | unplaced | unplaced |
Overall position | ||||
1st | 7th | 10th | 23rd | |
About Network Rail
We own, operate and develop Britain's railway infrastructure; that's 20,000 miles of track, 30,000 bridges, tunnels and viaducts and the thousands of signals, level crossings and stations. We run 20 of the UK's largest stations while all the others, over 2,500, are run by the country's train operating companies.
Usually, there are almost five million journeys made in the UK and over 600 freight trains run on the network. People depend on Britain's railway for their daily commute, to visit friends and loved ones and to get them home safe every day. Our role is to deliver a safe and reliable railway, so we carefully manage and deliver thousands of projects every year that form part of the multi-billion pound Railway Upgrade Plan, to grow and expand the nation's railway network to respond to the tremendous growth and demand the railway has experienced - a doubling of passenger journeys over the past 20 years.
Follow us on Twitter: @networkrail
Visit our online newsroom: www.networkrailmediacentre.co.uk